Revenue driver

Link requests went from days in an Ad Ops queue to under 60 seconds

Affinity CPA publisher portal · Associate UX Designer · Solo design with Eng and Ad Ops · 2026

< 60 sec

Programs table to live tracking link

by design

0

Ad Ops steps in the request path

design fact

4 levels

Drill path: Daily › Program › Geo › Sub ID

design fact

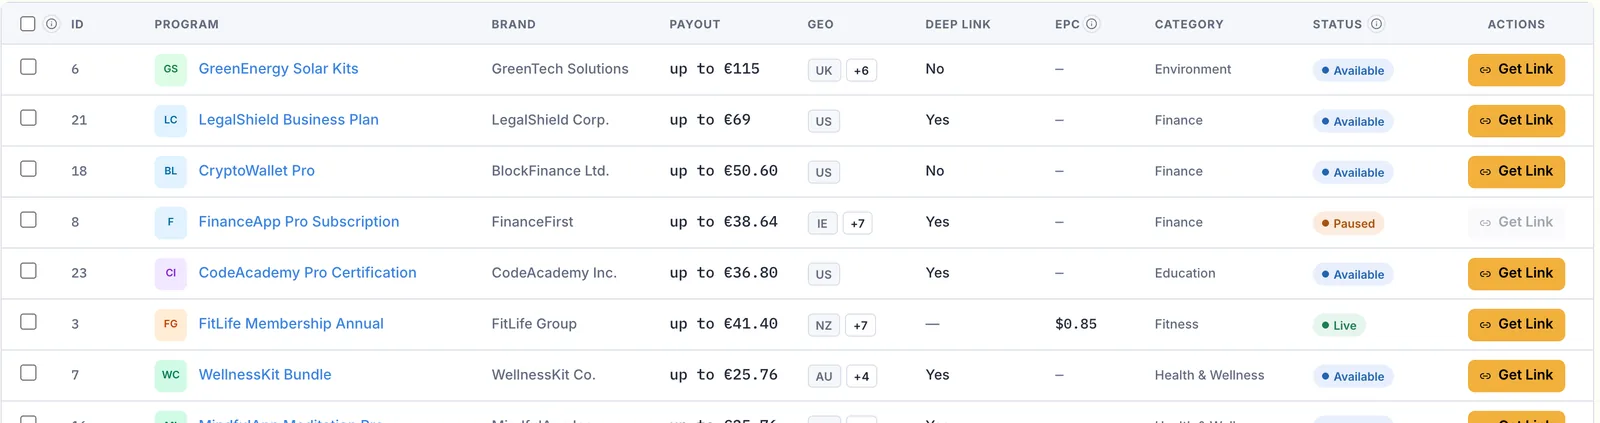
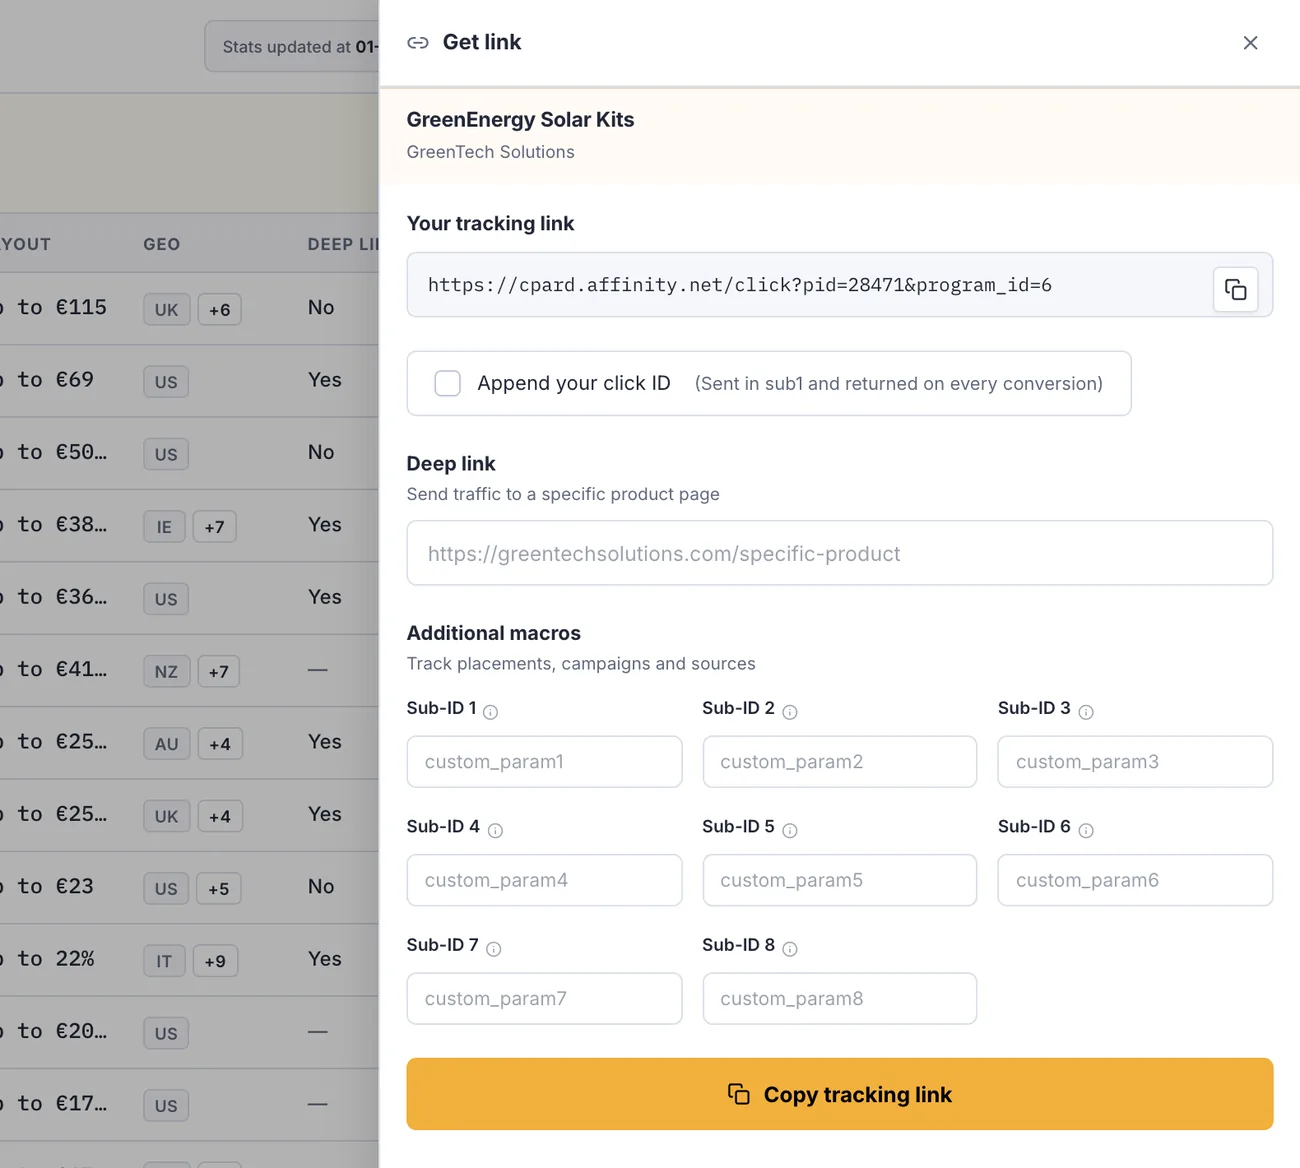
Browse Programs table. Get Link opens a side panel with the tracking link ready to copy, then confirms Copied to clipboard.
Programs table to copied tracking link. Prototype screen, illustrative data.

The problem

Publishers emailed Ad Ops for every tracking link and waited a day or more. Until it arrived, they could not promote a program or earn from it.

The gap was not a missing dashboard. It was the wait between a publisher’s intent and their first tracked revenue.

Two questions shaped the scope.

B

Reports

Can I trust what I’m paid?

Decision 03

Drill down instead of rebuilding the filter

Tension
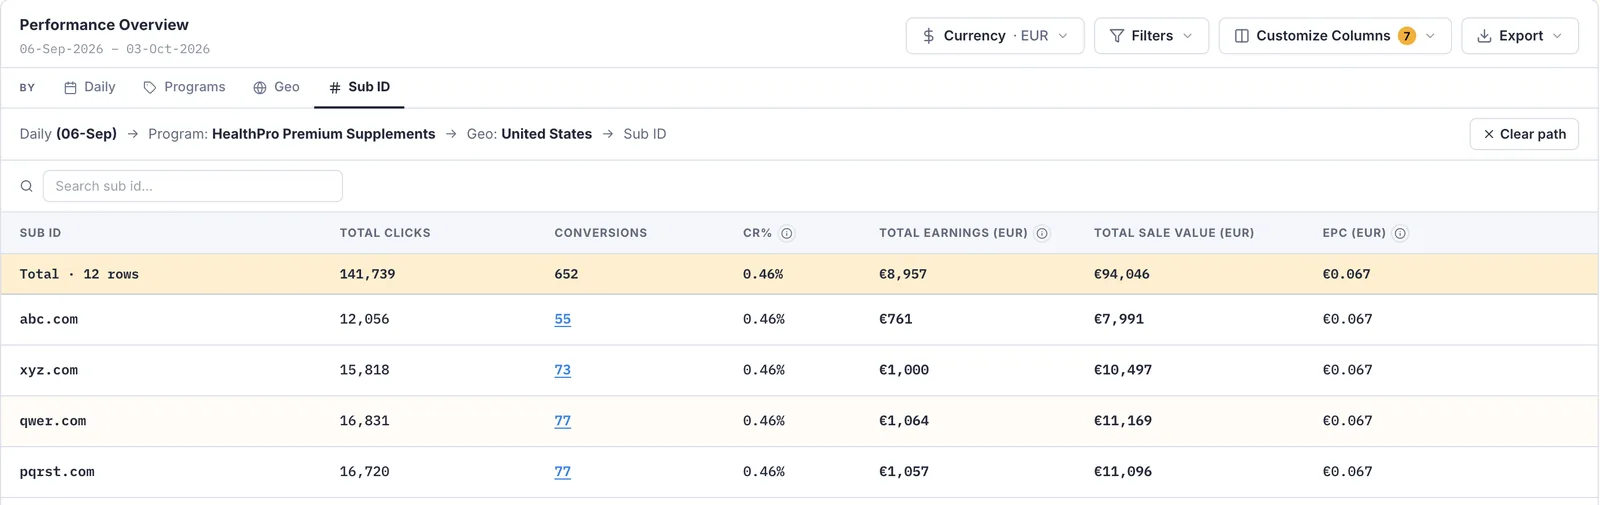
“Earnings are down” is a nested question: day, program, geo, Sub ID.
Rejected
Four separate reports, and every column shown by default.
Result
One table with a visible drill path and Clear path. Seven columns by default, the rest in Customize Columns. A pinned totals row states how many rows it sums.
Daily Stats drilled to Sub ID. A drill path reads Daily 06-Sep, Program HealthPro Premium Supplements, Geo United States, Sub ID, with a Clear path button. Below it, a totals row and per-Sub-ID rows.
1Drill path: Daily › Program › Geo › Sub ID2Totals row states its row countPrototype screen, illustrative data.

Decision 04

Show restated payouts beside the original

Tension
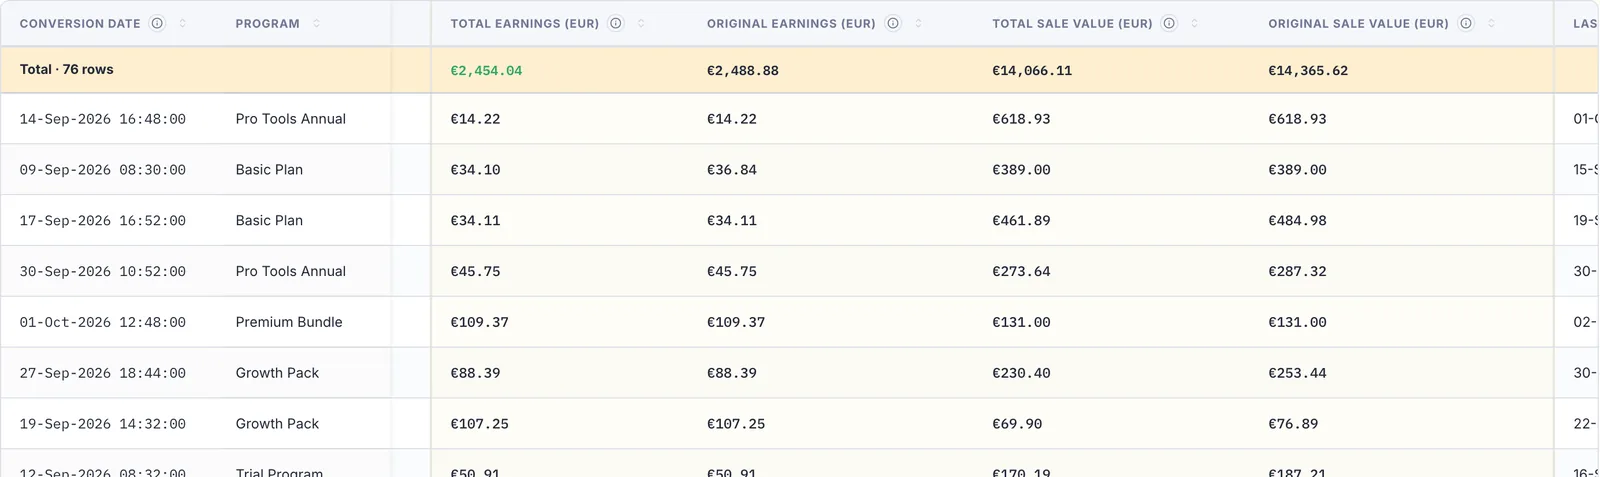
One conversion carries 21 columns of facts, and trust breaks when a restated number silently replaces the old one.
Rejected
Charts first, and overwriting values in place.
Result
A row-level ledger with Conversion Date and Program frozen. Original and current earnings sit side by side.
Conversion Reports scrolled to the money columns: Total earnings and Original earnings, Total sale value and Original sale value, side by side. Conversion Date and Program stay frozen on the left.
12 frozen columns of 212Original vs current: €36.84 → €34.10Prototype screen, illustrative data.

Also shipped

What I did not build

A full analytics suite with charts first. The bottleneck was the wait for a link, and the open question afterwards was trust in payments. So reporting shipped as two purpose-built reports instead of a general dashboard.

Result

< 60 sec

Programs table to live tracking link

by design

0

Ad Ops steps for standard link requests

design fact

20+

Programs in the portal

v25 prototype